
¶ The Minor Fall, the Major Lift · 13 October 2013 listen/tech
Here's another little postscript to The Unbearable Sadness of Pop Songs, in which I examined The Echo Nest's statistical evidence for Glenn Schellenberg's contention that popular music is getting sadder.
Schellenberg used (primarily) minor keys as a representational proxy for sadness, and in his small data set found that minor-key usage in pop hits increased dramatically over the last 50 years. In our much larger data set this trend was arguably present, but very slight.
But is this underlying minor=sad premise itself even right? It's a customary qualitative observation that minor keys mean sadness, but does that idea hold up quantitatively?
At The Echo Nest our audio analysis of hundreds of millions of songs includes computational attempts to measure both semi-objective things like tempo and loudness and major/minor, and wholly subjective things like danceability and energy and happy/sad valence. The subjective ones are done by using machine-learning to extrapolate from human training data, so we're not relying on computers to spontaneously develop emotional responses to music of their own volition.
We can analyze these variables at the level of individual songs, but the amount of variability there is naturally high, and the results are difficult to appreciate in aggregate, so for both statistical and comprehensibility reasons it's maybe more interesting to analyze them at the aggregate level of kinds of music.
Here, for example, is an XY scatter-plot of our 700+ music genres according to their aggregate valence (up is happier, down is sadder) and energy (left is calmer, right is more agitated).
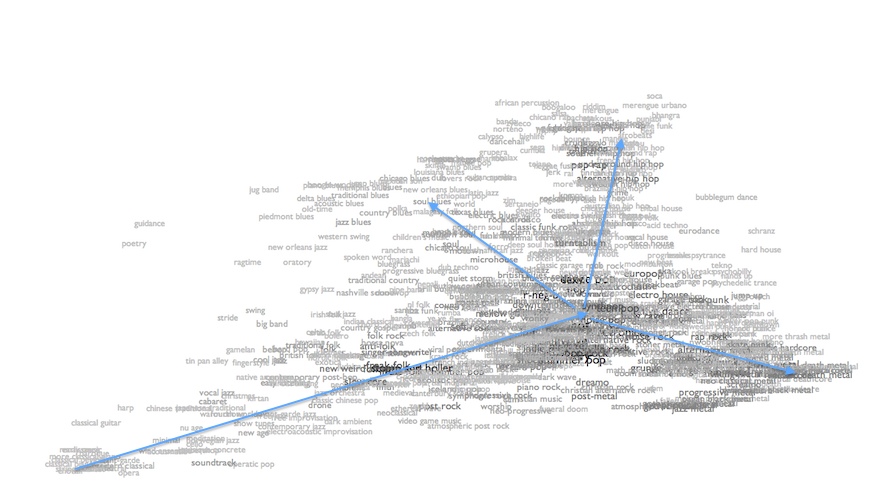
valence/energy
Moving up and right from the bottom left corner we do see a pattern of classical and traditional genres getting both more energetic and happier. After that, though, things get more complicated. As forms get really highly energetic, they tend to get subjectively darker. Not sadder, exactly, but angrier: rock, punk and metal end up down in the bottom right. Perpendicular to this, more or less, we see a bunch of latin and hip-hop forms going upwards, getting happier or more positive in mood without getting a lot more energetic. And towards the top left are a bunch of forms that are more positive on calculated aggregate despite having lower aggregate energy. Intriguingly, this last set includes a bunch of blues forms, which you might expect to have low valences, because "blues" is inherently about sadness, right? But our data suggest otherwise, and if "blues" is really music created in reaction to hardship, then maybe this is actually what we should have expected.
For a clearer demonstration of correlation, here's a plot of valence against "bounciness", an experimental analytical measure of rhythmic intensity (dense, atmospheric music is less bouncy; spikier music with sharper and stronger beats is more bouncy).
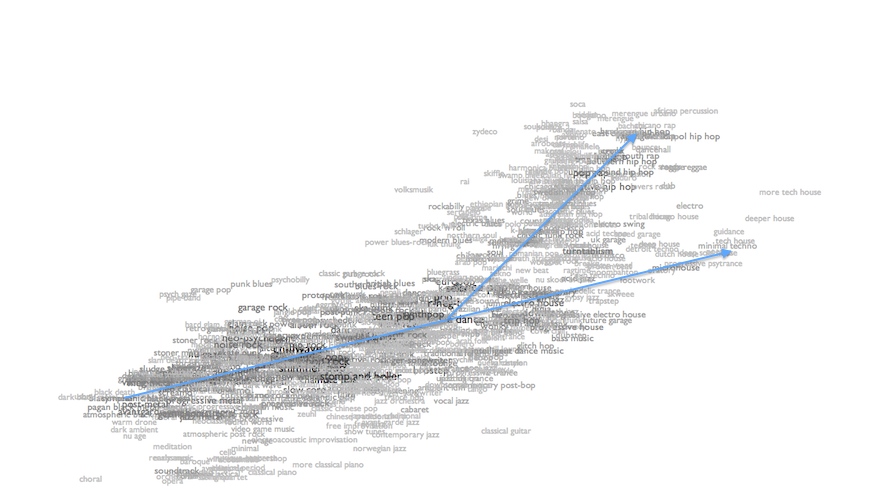
valence/bounciness
Again up is happier and down is sadder/angrier. Left is less bouncy, right is more bouncy. At the bottom left we see a bunch of drone and dense metal forms that are both dark and highly unbouncy. Moving up and right we find a pretty reliably consistent diagonal pattern of increased bounciness leading to increasingly positive emotional reactions, and the densest cloud of forms even shifts up and rightwards more sharply after the middle of the world, leading to things like soca and reggae and merengue that are highly upbeat in both the rhythmic and emotional senses. The "beat" in "upbeat" is not a linguistic anomaly.
But here is the plot of valence versus minor/major keys.
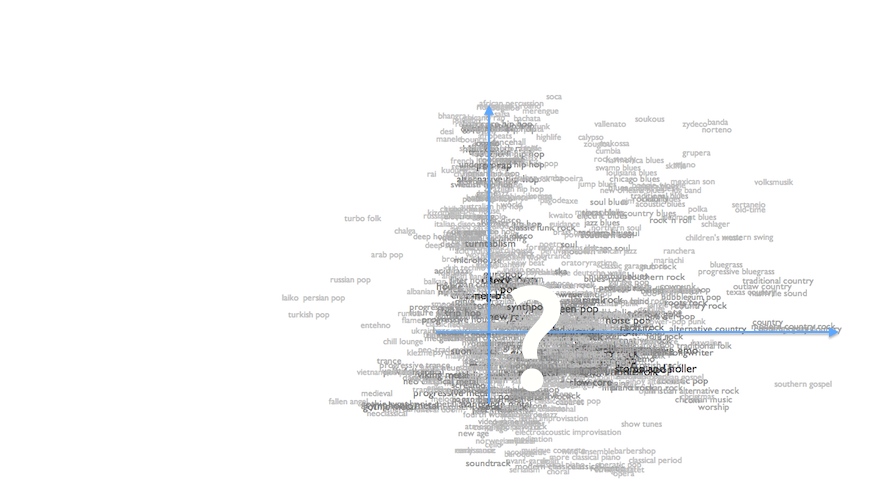
valence/majority
Left means more songs in minor keys, right means fewer. If minor keys meant sadness as axiomatically as we conventionally believe, this plot should be a thick diagonal line from the bottom left (more minor-key songs means more sadness) to the top right (fewer minor-key songs, more happiness). As you can see, this is rather evidently not the case. In fact, the main thing we see here is a dense vertical axis of forms that cover the span of emotional valences despite having about the same prevalences of minor keys. There's also a notable line of country forms that get more and more exclusively major-key without getting any collectively happier. And although there's a generous scattering of roots-oriented forms up in the top-right quadrant where we expected major-key dominance to correlate with more positive moods, they're a relative overall minority, and arguably the southeasterly diagonal within them is as apparent as the northeasterly diagonal we were trying to stipulate.
None of this should be taken to end this discussion. Measuring emotional responses is hard, and one could reasonably wonder whether these plots reveal some systematic tendency of our algorithms to underrate the subjective sadness of the blues. In multiple iterations we haven't yet found this to be the case, but that doesn't prove it isn't so.
Or, maybe even more interestingly, it might be that human listeners report their emotional responses in systematically different ways than we feel them. Basing computational aesthetics on human self-awareness is maybe not all that much more reliable than basing it on computer self-awareness, and maybe we'll have to wait until computers wake up to be able to find out if they'll know themselves better than we know ourselves.
Or, maybe, this old simplistic minor=sadness thing is just kind of wrong.