¶ Every Noise at Once · 8 April 2013 listen/tech
I started making pictures of the music-genre space for diagnostic purposes at work. The exercise keeps threatening to take on a life of its own, but then each new thing turns out to have some functional purpose after all. Which leads to some other analytical feature, which leads to yet another interesting by-product.
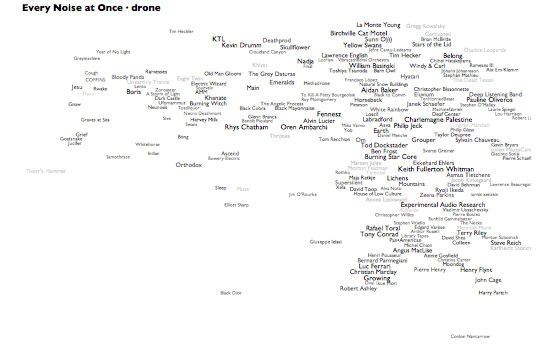
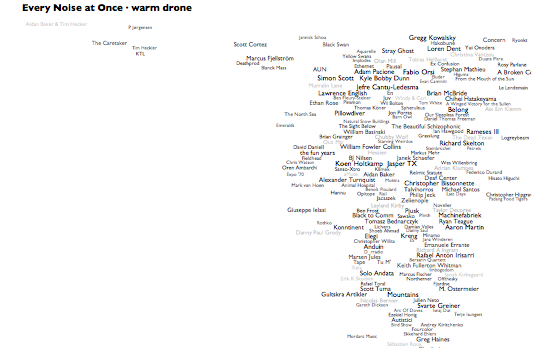
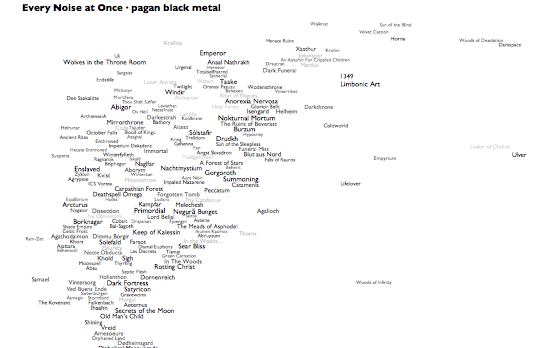
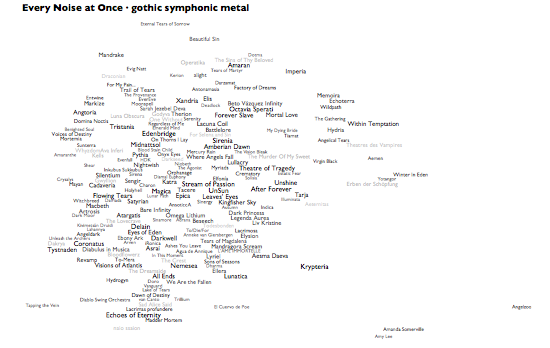
This latest not-so-analytical version here adds a whole new level, literally. If you hover over, or click, any genre in the main map, you'll see a » link. Click that to see an artist-level map of that genre, complete with representative audio for each artist and a genre-specific car-radio scanner.
In addition, I've now made auto-generated introductory playlists for each genre on Rdio, and there are links to these at the bottom of the individual genre maps. Rdio's "related artists" come from the same underlying Echo Nest data and processes that drive these genres and their maps, so between these pictures, the Rdio intro playlists, and Rdio related artists from the artists of the songs on those playlists, there's the rough, erratic beginnings of an exploratory path that can lead you from an of-course-inadequate attempt at a overview of all music into at least a representative subset of its component songs. The intro playlists alone add up to about a complete calendar-year of music, which I think says as much as anything about the relationship between humanity and music.
People keep asking me, very reasonably, what the "axes" are on these things. They aren't exactly data plots, due to the cheerfully aggressive algorithmic rearranging of names to make them readable. But roughly speaking, left is more electric and right is more acoustic. And even more roughly speaking, up is more sonic density or uniformity, down is more sonic spareness or spikiness. The less data, the looser the correlations, so the artist distribution within a genre tends to be necessarily less precisely data-related than the distribution of genres. And the genre views are normalized individually, so the bands at the right edge of pagan black metal are actually far less acoustic than those at the right edge of warm drone. If you really want to worry about dimensional distributions and standard deviations, you should come work at the Echo Nest. Otherwise, just focus on the juxtapositions and clusters, and make up your own mind whether they help you think about anything.
Also, lest you think my "Every Noise at Once" title is idle, note that if you alt-click to open different genres in different browser tabs you can turn on lots of scanners at once. I'm not advocating this, exactly, but it is a thing that you can do.